Introduction
I always want to build an application that has a dashboard. I decided to start building the dashboard using the GitHub API. I started the project called git-board which is is a dashboard for the top 100 repositories based on GitHub Stars.
Final Design
- Home page

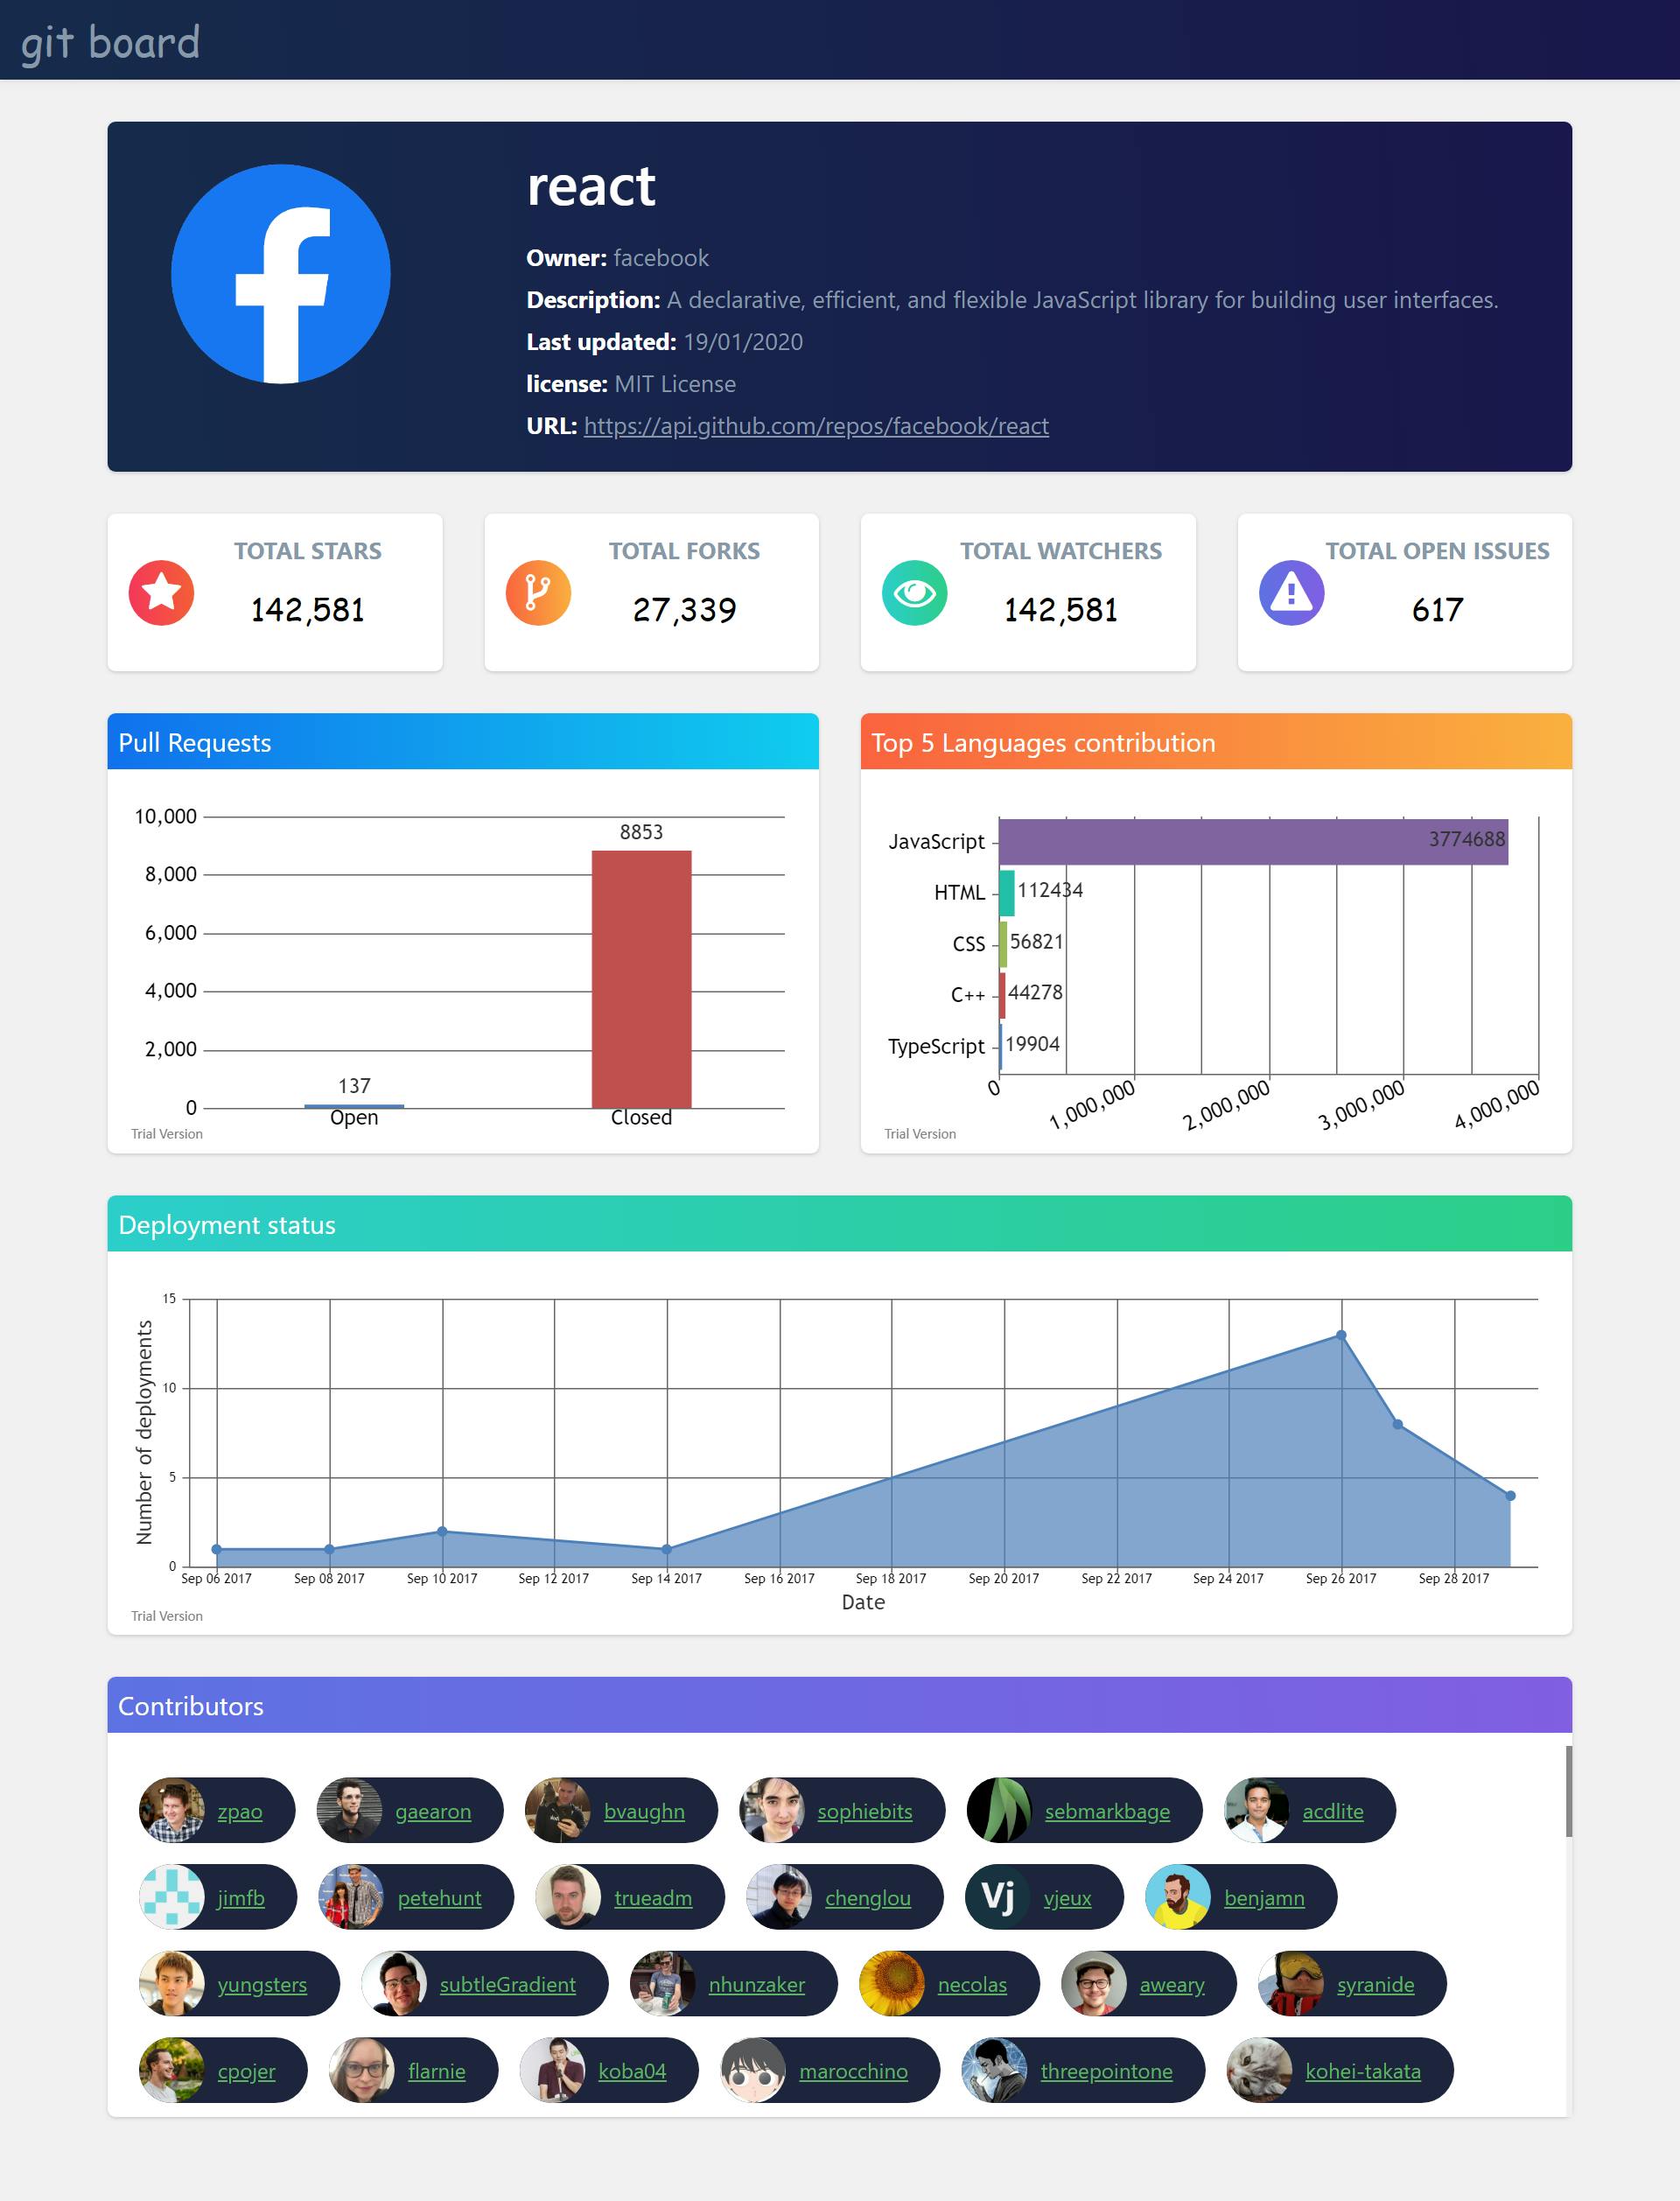
- Dashboard page

Technical approach
- Create the base app using create-react-app
- create two pages home page and dashboard page. The home page is the landing page that lists down the top 100 repositories. The dashboard page is the main page that shows the detailed view of the selected repository.
First created a Header component that is different based on the route as shown below
Home page header

- Dashboard page header

4) Use the fetch API to fetch the data from the Github API 5) In home page list down the top 100 repositories in card format with their logo, name, and description as shown below

6) Build a search box for filtering out the repository as shown below

7) on click of the card, we are navigating to the dashboard page and passing down the selected repo owner name and name.
8) In the dashboard page, we have created the grid using the flexbox based on our design
9) I have used the canvasjs charting library for visualization. Based on the types of chart I have to build a component like BarChart, columnChart, etc.
10)In the dashboard page, I have used the multiple GitHub API using the promise.all. Based on the data render the respective chart.
11) The final output of the dashboard is similar to as shown below.

Demo Video
Resource
If you like my work please give a star as an appreciation on my GitHub repository.